
Some GCN GPUs in 16 games and 4 benchmarks
- Sasha W.

- Jun 6, 2019
- 14 min read
Oh wow this took me ages to do. But here I am actually writing the post on it. Honestly I am really tired and a bit depressed so I am, maybe, going to keep the typing to a minimum and just maybe let the results speak for themselves. Actually I will probably type a ton of crap anyway so just bear with me.
I tested my R9 280X, R9 290X, R9 380X, RX 570 and RX 590 in a load of games and a few benchmarks to evaluate how they performed against each other, while limited to 1000 MHz core and 192GB/s memory bandwidth. With some exceptions, more on that in a moment...
Okay this is a pure synthetic test honestly, for example the Tahiti GPU powering R9 280X was never designed to be limited to 192GB/s, so it will underperform when restricted like this. But why do it, you ask? Because this under-performing also helps me evaluate how much more efficient (especially regarding memory bandwidth) the newer chips are. Well, the ones with the same top-level structure.
There are a few notes though. Firstly, R9 290X wasn't tested at 192GB/s, because this would be completely pointless, as the Hawaii GPU has significantly more Render Back-Ends and Compute Units than the other chips. So I tested this card at reference clocks only. Secondly, RX 590 was tested even though it has 4 more CU than the 280X, 380X and 570. I tested this at the same core clock and memory bandwidth as I was curious to see how much difference the extra 256 SP and 16 Texturing Units actually made, nothing more.
I was unable to test the RX 590 at reference clocks because I was having issues keeping it GPU bound in my Test Suite. yes, my Ryzen 3 1200 is now holding back my test PC. Yes, I could have tested the 590 in the main PC with the 2700X but I am suffering a lot from anxiety and I just got the Radeon VII working and I don't want to remove it again. Okay?
And lastly, I tested the three main comparisons (280X,380X and 570) at their AMD-specified reference clock rates to measure product performance, this would not be a synthetic result. Please keep in mind that even though I think almost all R9 380X cards launched with higher speeds, AMD reference spec is quite low. Especially compared to 280X. This is what I tested with.
Oh look, I typed a huge amount...Anyway let's move on to the results after I give you details on the test rig:
Ryzen 3 1200 quad-core CPU @ 3.7 GHz
16GB (2x8GB) 2400 MHz CL14
MSI B350M Mortar
Silverstone Strider 1000W Gold PSU
AMD Radeon Adrenalin Driver Version 19.4.3
Note: As I mentioned above, yes I am aware the Ryzen 3 CPU here is bit... weak. I mean it was really cheap, but still a good CPU. Remember back before 2017, 4 threads was premium mid-range! (Thanks Intel). At least this one cost what it was worth. Anyway... I am making sure all results are GPU bound by analysing reported D3D Usage reported by Driver and Operating System, and then re-testing results that I suspect, with significantly lower CPU clock rates to verify that the result doesn't change, or at least, not by a huge amount. As you can see most of my results are not particularly high FPS. That is because I am using settings to emphasis GPU workload. Also, I am looking to get a new CPU for my test PC, probably a Ryzen 5 3600. Please just bear with me until then :D
Secondary Note: Yes, most of the titles I benched were using the built-in benchmark. Why does this not "bother" me? it is because it is not really a measure of their in-game performance. This is a synthetic test of GPU rendering performance under artificial limitations to compare architectures. It doesn't matter where the scene is benched. That said, A couple games I wanted to test didn't have a benchmark so I benched those in-game with Afterburner.
Tertiary Note?: You will notice I am using Low, medium or "normal" textures. That is of course deliberate, as this is a measure of GPU render performance, not VRAM restriction performance. The R9 280X is the weakest link here with "only" 3GB of video memory, and that is actually becoming really tight even at 1080p, let alone 1440p. Textures don't have an enormous impact on rendering performance so the results are still relevant.
Results!
The first graph results are with all listed GPUs at 1000 MHz core speed, and memory data-rate adjusted to provide 192GB/s. For the 256-bit cards this is 6Gbps, for the 280X which has a 384-bit memory interface, this is 4Gbps. This is synthetic test.
The Second graph includes the cards, with 590 replaced with 290X, at reference speeds to compare the GPUs at their "normal" operating frequency. This is less of a synthetic test.
Sleeping Dogs

Sleeping Dogs gains almost 14% from GCN1 to GCN3, when bandwidth and clock normalised. Tonga does have significantly better bandwidth efficiency due to the ability to compress frame-data on the fly, reducing bandwidth requirements in any given scene. Obviously, you are also seeing major Tessellation and primitive-rate gains thanks to doubled (and improved per clock) Geometry and Raster Engines.
RX 570 gains a very small amount, under 2%. This result was repeatable and measurable, but it is within margin of error so make of it what you will. I think Polaris is running into another limitation here, likely Compute through-put. I say that because with the 590 having the full 36 CU enabled silicon, we see 11.2% increase in performance. That is almost linear scaling with the 12.5% more stream processors this GPU has enabled. So Tahiti was unable to feed its compute units due to, likely, lack of memory bandwidth in this test, but Polaris can feed more CU due to larger L2 cache and DCC. Gains!

Well, that sort of backs up my theory that Tahiti is bandwidth limited here. Once Tahiti's memory speeds are unrestrained, and the chip can pump 288GB/s, it actually manages to essentially match Tonga's result in the first test. This shows that Tonga does have major bandwidth efficiency gains. Oh, and it's interesting that at AMD's reference spec, the 380X is actually slower than the 280X, but not by much. 290X here leads the pack with is comparatively enormous Compute and bandwidth on tap, but un-restrained RX 570 does get within 10%, at likely half the power consumption (but I didn't test power consumption. Yet).
Batman: Arkham Knight

Nothing much to report here, small, but definitely noticeable gains between the 3 major comparisons. And the 590 added to see what the full Polaris silicon can do at these speeds, too.

But once we set all GPUs to their "reference specifcation" clock rates, the situation changes a bit. The 280X and 380X are equal in performance, but this is okay in my books for gains, if you consider that the Tonga chip is working with significantly less memory bandwidth and slightly reduced engine clocks to achieve that result. Those are gains, but the consumer wouldn't really notice it. I always considered the 380X to be a sort of, replacement of the 280X, and indeed, it was $70 cheaper. So consider it the same performance, for less price, and higher efficiency, and a gigabyte more video memory. RX 570 almost matches the 290X here, I guess Gameworks tessellation effects are less intensive on the Polaris silicon, with its Primitive Discard, in hardware, and significantly higher core clocks.
BioShock Infinite

Pretty linear scaling here with these GPUs. the Tonga gains 15% over the Tahiti at the same clocks and bandwidth, a decent jump. Tonga to Polaris is half as much, at just over 7% but this is also a decent gain as both these chips feature the same Geometry Front-end. Remember that Polaris has a larger L2 Cache, over twice the size (2MB vs 768KB) and in-hardware Primitive Discard, along with superior DCC algorithms. The extra 4 CU on the 590 provide with with 8.5% higher performance here. That is fairly close to the % gain of extra CU so the scaling is reasonable.

Things are different now the GPUs are unrestrained. The 280X shows yet again that it can match or beat the 380X, simply by brute-forcing the bandwidth equation. 570 and 290X are evenly matched, decent gains for Polaris from architecture and of course raw clock speed.
HITMAN

In HITMAN we see a larger gain from GCN1 to GCN3, and a smaller one to GCN4, like we notice in other games. Of course, actually adding twice the physical hardware logic is the best approach, right? Also, the additional 256 stream processors and 16 texture units on the RX 590's GPU provide 9.6% more performance here.

It is worth noting here, that even with the Tonga chip in the 380X operating at its lower, AMD "reference specification", it can still provide more performance, despite the Tahiti GPU in R9 280X having 58% more raw memory bandwidth (and 3% higher GPU engine clock). This game is using a DX12 renderer, so maybe it has something to do with Tonga's superior hardware-feature support for DX12 (12.0 vs 11.2, Tahiti supports DX12 in API/Software only). The 290X's bigger Hawaii GPU muscles to the top here, but only leading over the Polaris 20 (PRO) chip RX 570 by 7.7%. Polaris's higher raw clock rate and architecture improvements are in action.
Metro 2033 Redux

One of my favourite games! In Metro 2033 Redux, there are nice and solid gains for each card over the previous. Nothing really noteworthy to point out but as you can see between the 3 GPUs with 32 CU (2048 SP, 128 TMU) and 32 ROP, there is 21% "IPC" increase between GCN1 and 4, from various architectural, and other improvements to the non compute/render parts of the GPU. AMD hasn't been doing nothing all this time apparently! (But I knew that already).

The actual, product gains here are much smaller between 380X and 280X, as we saw before also. But I am looking at it architecturally, and Tonga is for sure more efficient whatever way you look at it. RX 570 pulls far ahead as expected from that 24% increase in clock rate. R9 290X actually strikes a draw with the RX 570 here, Metro 2033 Redux is quite heavy on the geometry/tessellation aspect so that is likely playing a part in that.
Middle-Earth: Shadow of Mordor

Here is Shadow of Mordor. I do think this game is bandwidth limited on the Tahiti, as we have seen before. You'll see what I mean in a moment...

A common occurrence is for the R9 280X, when using its reference memory speed, to match or beat the R9 380X even during the first test at 1 GHz and 192GB/s. This really does show that when we artificially limit Tahiti to 192GB/s it is actually bandwidth starved in many frames. And also that Tonga is significantly more efficient when working with just that memory bandwidth.
Rise of the Tomb Raider

Tahiti again showing either major geometry or bandwidth limitation. Probably both. Also this is DX12 so keep that inferior Hardware support in mind (it can make a difference). Otherwise, Polaris needs those four extra Compute Units to really make a difference over Tonga at the same speeds, but there is at least a small gain at 32 CU for GCN4.

Okay so from this we can see even with significantly more memory bandwidth, Tahiti is still eclipsed by Tonga, and the latter is actually running at lower core clock, too. Geometry performance potentially important here. Either way, the R9 290X can muscle through the frames (or parts of the frame) that require comparatively less geometry performance, and more Compute, and produces a higher overall frame-rate because of that.
Tomb Raider (2013)

In the original new remake of the Tomb Raider game, the GPUs are all fairly close looking at the graph but gains can be seen. But adding more shaders seemed to have the most profound effect.

But when the cards operate at reference speeds, Tahiti claims a victory over Tonga, by way of brute force. RX 570 is hot on the heels of 2013's Radeon champion, too.
Ashes of the Singularity: Escalation

Ashes of the Singularity does use an engine built for DX12 from the ground-up, unlike many of the other games using DX12 I tested here, which are largely based on DX11 ground work. It's interesting to note that Tahiti doesn't suffer too badly here. From what I am aware, Tahiti does have Asynchronous Compute cability, but it isn't working to the same extent as GCN2 and above. Anyway it doesn't hurt it too much here, and all the GPUs seem to have gains, but GCN3 to 4 is a bit smaller.

Course, since AMD's reference spec for 380X is actually lower than my synthetic test standard, 380X regresses a bit here and the 280X can claim the same performance within margin of error. Still not a bad result for Tonga in my eyes, because it is working with vastly less bandwidth. Also interesting is 290X can only just out-muscle RX 570, something I see before now, too. At normal clock speeds, R9 290X produces around 10% more theoretical 32-bit FLOPS than RX 570, but 60% more raw pixel-fill rate. However, RX 570 can put out 22% more primitives per second in raw hardware, and that is before gains from Primitive Discard are factored in.
The Witcher 3

Straight off the bat that's a 32% increase in generation performance from GCN1 to GCN3 with the same number of Compute and Render back-ends. Geralt's NVIDIA-written, HairWorks-accelerated hair may have something to do with that. I believe it is geometry heavy. Polaris also gains here and that too has geometry improvements.
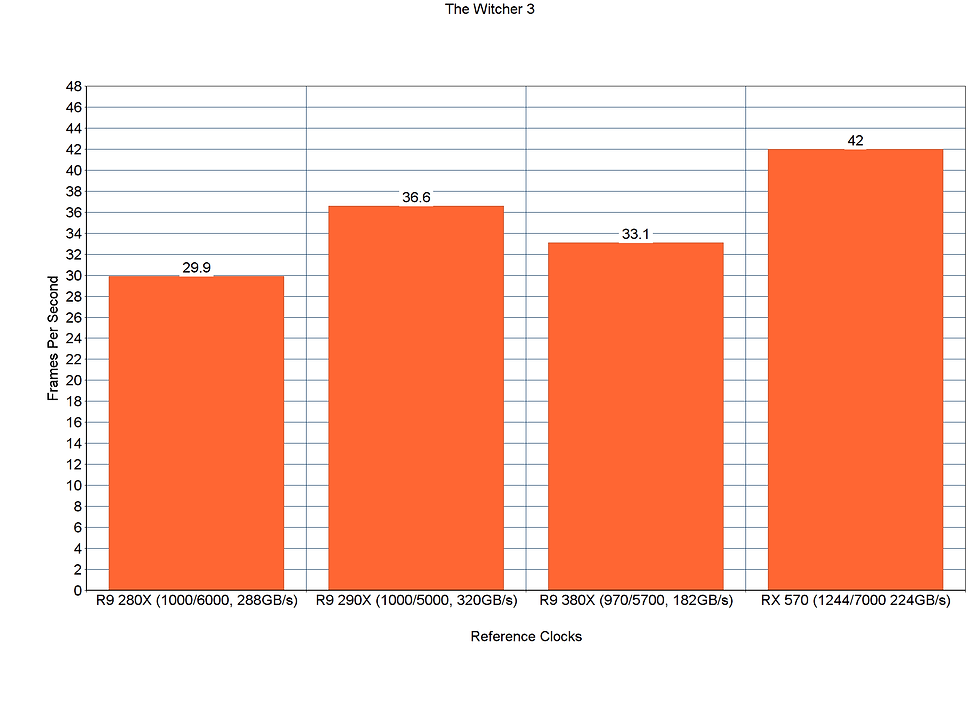
Even vastly more raw bandwidth cannot save Tahiti from being beaten by Tonga, so it does seem like AMD has made gains with HairWorks with the generational upgrades. Here, the comparatively hot-clocked RX 570 pulls ahead even in front of the R9 290X, this indicates to me a primtive-rate/tessellation heavy workload.
Stalker Clear Sky Benchmark

This bench takes 87 years to complete. This bench is the primary reason why I have taken this damn long to make these results. Seriously, it takes like 5 minutes and I retest 3 times so you get like 15 minutes PER CARD of pure waiting around. That's OVER AN HOUR of benching across all cards for this one damn benchmark. Oh, woops. I didn't speak about the results yet, I was too busy moaning.
Oh yes, here we can see some gains from Tahiti to Tonga, but none from Tonga to Polaris. They score the same, within a margin of error. This is DX10, so maybe that has something to do with it. Again here the only way Polaris can distinguish itself from its older GCN3 brother is by using those four extra Compute Units it has on silicon, showcased here by the RX 590.

Tahiti can catch up to Tonga here, when it unlocks its normal memory bandwidth. R9 290X has a slight lead on RX 570 but you wouldn't notice it, in-game, at least in this scene. But you would notice the leaf blower in your PC in the former's case.
Metro Exodus

One of my favourite games, aside from Warframe. Okay well Tahiti is well and truly left behind here. By an even larger amount than the additional of 256 Stream processors on the 590.

Well it isn't a bandwidth issue for Tahiti. Metro Exodus does have some extremely complex geometry, and it pretty shader intensive, too. The 290X can even trade blows with the RX 570 showing me that it cannot be entirely a geometry issue. Whatever the case, architectural gains are allowing Tonga to extract more performance from the same amount of Render and Compute.
Gears of War 4

In Gears of War 4, a native DX12 game, Tahiti is crushed by the newer chips, Polaris has a small, within margin of error lead, so I disregard that honestly. The 256 extra Stream processors allow the 590 to muscle ahead of the other cards, though.

At reference speeds, Tahiti cannot even catch the lower clocked Tonga-based card. RX 570 uses power of pure clock speed to pull ahead and even manages to match the once mighty Hawaii-based R9 290X.
Fallout 4

Similar story here. Tahiti falls behind the quad-raster chips, and Polaris doesn't seem to gain a lot in this game and scene. Adding more Compute units helps, though.

Polaris here showing that increasing the switching speed of the circuit is a sure way to improve performance. But in reality it is also helped by architectural improvements. Here it can beat the R9 290X with much less memory bandwidth.
Warframe!

Is it just me, or does no one bench this really, awesome game? I'm not bias by the way. But it really is the best game. Ever. But let's look at how these GPUs perform. Okay, well look at that. Warframe really does scale with those doubled geometry engines and/or higher bandwidth efficiency. Polaris also shows some gains over Tonga, here, and even more so when you throw more Compute at the equation. At 10.1%, this is very close to the 12.5% increase in Stream processor count, so it is scaling well with more Number Crunching hardware.

I think Warframe's geometry is enough and the FPS is high enough that the dual-raster design of Tahiti is becoming a limiting factor for it. In fact, since the RX 570 manages to produce a sizeable lead of just over 8% on the R9 290X, we can almost safely say this is thanks to the higher geometry performance afforded by the Polaris GPU and its higher clock speeds / architecture improvements.
World of Tanks Encore Benchmark

Okay so this isn't REALLY a game but, it sort of is. It's more of a game than, say, Firestrike. And I also had the Stalker Clear Sky benchmark in here, too, which is a standalone bench for that game. Anyway, I told my friend and he said I should say that this benchmark isn't indicative of the actual World Of Tanks game performance, at least not anymore as they changed it a lot, I guess? Either way it is another graphics workload so let's look at the results.
The benchmark provides a score, not an average Frame Rate, but that is okay as it should be closely linked. We see some noticeable gains from all cards, indicating all iterations of GCN with 32CU have gains over the previous ones. Oh, and 4 extra CU help, too. But we knew that already.

Things change a bit, when Tahiti is given its full Bandwidth potential. It manages to edge out the Tonga, also because Tonga is running with a deficit here, too, thanks to AMD's somewhat conservative "reference spec" for this card. R9 290X muscles ahead, even beating out the newer and leaner RX 570, but not by a huge amount.
Okay now for some Pure Benchmarks!
Unigine Superposition

This is a good looking benchmark from Unigine, and using a pretty good engine that no one seems to want to use for some reason. I think one game used, it "Oil Rush" it was called. Anyway Unigine benches have historically favoured NVIDIA, potentially due to high geometry requirements. I'm not so sure, though, as Polaris isn't showing any major gains over Tonga, even though it has hardware level Primitive Discard, which should easily work wonders on the scenes in the bench with all the stuff floating around and overlapping each other, at least that's what I would have thought.

Okay, so I think it is probably Compute limited here. Tahiti makes up its loss on the previous graph, when it has access to its 288GB/s of bandwidth. R9 290X pulls ahead of RX 570 by 5%, while producing 10% more raw 32-bit shader TFLOPS. Make of this what you will.
3DMark Firestrike Extreme

Here is Everyone's Favourite benchmark! it's Firestrike (Extreme)! All clocks and bandwidth normalised there are gains but they are fairly minor. I know this benchmark is heavy on Compute shaders. That still doesn't explain why the RX 590 doesn't pull ahead by more than what it does, though. Huh.

In hindsight I probably should have tested these at 1080p. Oh well, I think the 32 ROP parts are ROP hard-limited, since the 64-pixel-pipeline-equipped R9 290X here powers to the top spot in GT1, and adding clock speed helps the 570 get close. But in GT2 the 290X actually loses to the 570. Different bottlenecks in different scenes I guess.
3DMark Timespy

Concluding this test is with 3DMark's DX12 benchmark, Timespy. It's okay but I did read that it wasn't taking full advantage of GCN's implementation of Asynchronous Compute in order to be more friendly to NVIDIA's Pascal architecture, which had an inferior implementation. At least from what I read. Anyway, you can see the results are fairly close, but Tahiti lags behind the pack, and also is the only GPU here that is limited to 2 primitives per clock.

Throwing a ton more Bandwidth Tahiti's way doesn't do much to change the situation for it. And here the RX 570 basically ties the R9 290X. I guess Timespy geometry is quite heavy for these GPUs.
Okay, so I have actually finished this article. I thought it would take forever. You know, I sat down in two parts and did this almost non-stop. For a person with ADHD (Yes, I have ADHD, but not the kind that lets you mis-behave at school, this is the kind where I bash my head on door frames multiple times a day due to impulsive jumping because hyperactivity and being literally unable to concentrate on anything, including video games for more than 20-30 minutes.) Wait, I forgot where I was going with this. Oh yeah. I am pretty pleased that I managed to get this done. I hope you enjoyed it.
Thanks for reading <3


Comments